

glossary
Playable Conversion Rate
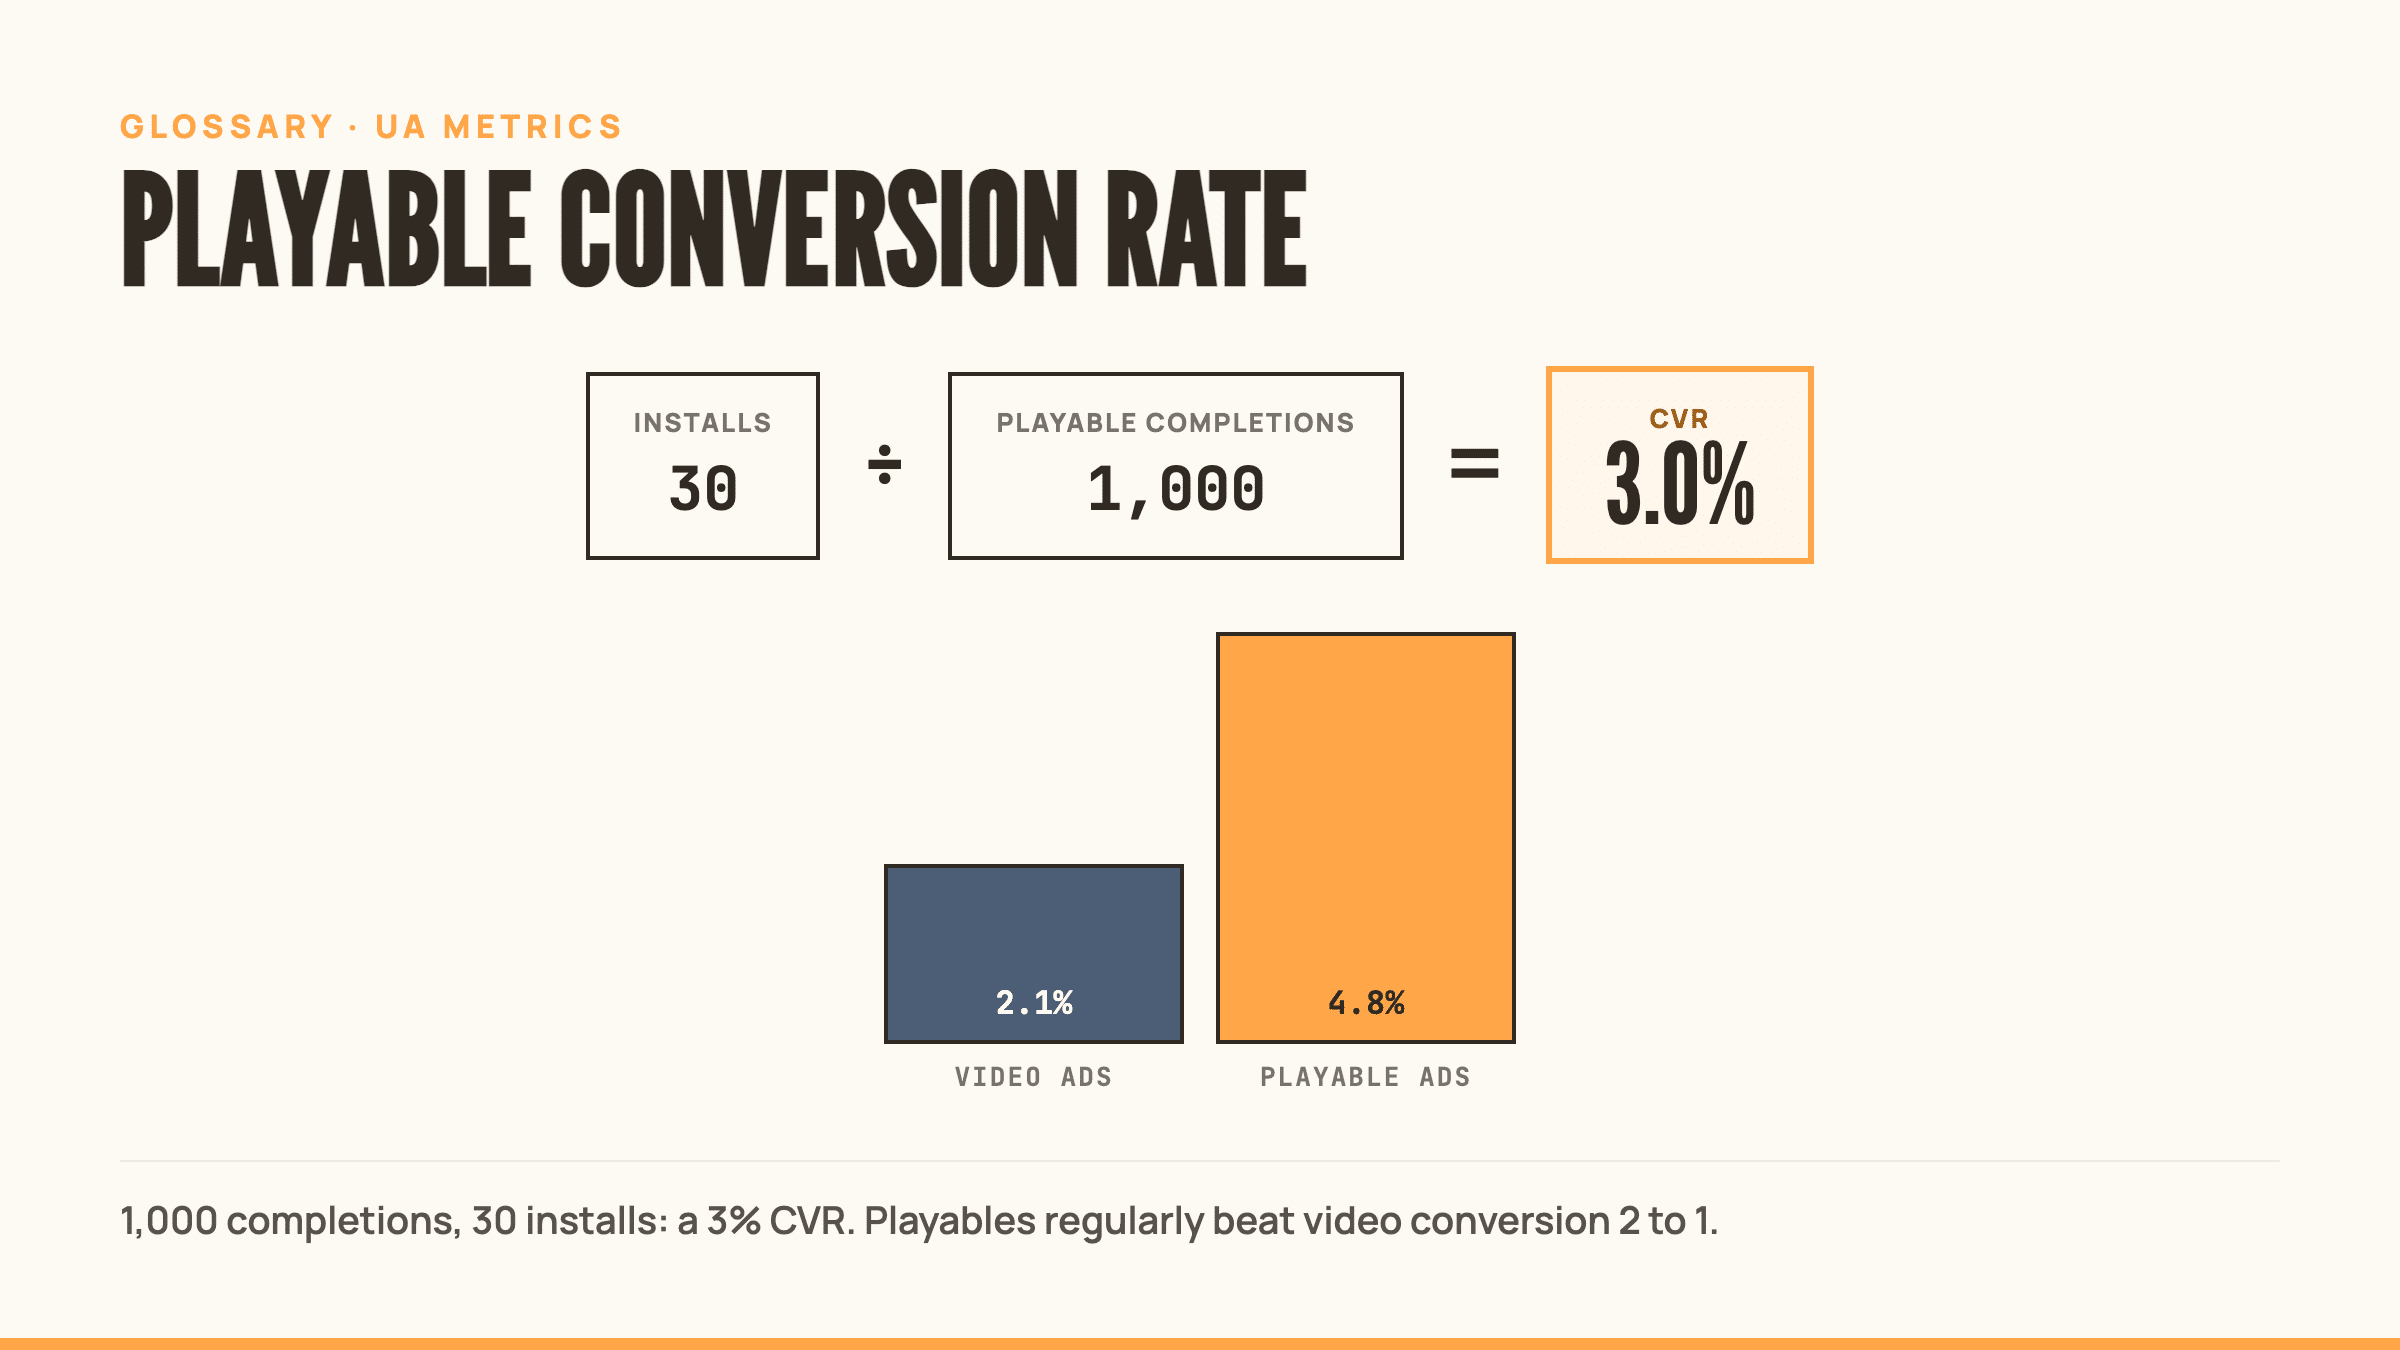
Quick Definition Playable Conversion Rate (Playable CVR) measures the percentage of users who install your game after interacting with a playable ad. Formula: Installs ÷ Playable Completions × 100. Good playable CVR typically ranges from 2-4%, but varies by genre and network. High CVR means your playable accurately represents the game experience and attracts genuinely […]
Quick Definition
Playable Conversion Rate (Playable CVR) measures the percentage of users who install your game after interacting with a playable ad. Formula: Installs ÷ Playable Completions × 100. Good playable CVR typically ranges from 2-4%, but varies by genre and network. High CVR means your playable accurately represents the game experience and attracts genuinely interested players.
What is Playable Conversion Rate
Playable CVR tracks how many users who finish your playable ad actually install your game.
A playable ad lets users try a simplified version of your game directly in the ad unit. When someone completes the playable experience and taps install, that’s a conversion opportunity. The rate tells you if your playable is attracting the right players or just generating empty clicks.
Unlike click-through rate (CTR), which only measures initial interest, CVR measures commitment. A player who installs after experiencing gameplay is signaling real intent. They already know what they’re getting.
The Math: “ Playable CVR = (Installs / Playable Completions) × 100 “
Example: 1,000 users complete your playable. 30 install. Your CVR is 3%.
Note: not every network defines this metric identically. Some report “playable CVR” as installs per click or installs per impression instead of installs per completion. Confirm which denominator your network uses before comparing numbers across platforms.
Industry Benchmarks
Playable ads consistently outperform static and video formats.
Performance Lift:
- Playables are widely reported at up to 319% higher conversion rates than traditional video ads, and up to 700% higher than static banners, per industry data cited by RevX and echoed across multiple ad-tech publishers
- Click-to-install rates average 2-4% for well-optimized playables
Retention Impact:
- Players who install post-playable tend to retain better than standard UA channels, because they already experienced the core loop before installing. Industry sources commonly cite a 30-40% higher retention range for playable-driven installs versus video-driven installs, though the exact lift varies by source and game.
Cost Efficiency:
- Playables generally run cheaper than video on CPI while delivering stronger downstream ROAS. RevX reports studios seeing up to 40% lower customer acquisition cost and a 70% lift in Day-7 ROAS after shifting budget to playables — treat as directional, not a guaranteed outcome, since results vary by game and network.
Market Adoption:
- Video still dominates mobile game ad creatives at roughly 80.9% globally in Q1-Q3 2025, with playable ads at about 5% and growing, per Mobvista’s XMP Global Mobile Gaming UA Trends report
- Daily playable creative volume topped 30,000 in 2024, per Liftoff’s Mobile Ad Creative Index
Factors Affecting Playable CVR
1. Game-Ad Fit
Your playable must match actual gameplay. Misleading mechanics generate high clicks but terrible CVR. Players bail when the real game doesn’t deliver what the playable promised.
2. Playable Quality
Bugs, lag, or confusing controls kill conversions instantly. Players judge your entire game by 15-20 seconds of playable experience.
3. Complexity
Highlight one core mechanic. Tap, swipe, or drag. Mixing too many actions dilutes clarity and confuses players. Shorter playables (<20 seconds) boost CTR by approximately 15%.
4. End Card Design
The moment between “fun demo” and “install now” is critical. Clean, full-screen end cards with centered CTAs boost visibility. Players spot centered buttons twice as fast. Interactive end cards lift CTR by 47% vs. static.
5. CTA Clarity
Vague CTAs lose conversions. Use concrete reward-focused messaging: “Install now for extra tokens” channels momentum better than generic “Download now.”
6. Tutorial Clarity
If players don’t understand what to do in 3 seconds, they bail. Clear visual cues and minimal text work best.
7. Difficulty Curve
Too easy feels pointless. Too hard feels frustrating. The sweet spot: achievable challenge that hints at deeper gameplay.
8. Reward Preview
Show players what they’ll unlock in the full game. Progression systems, characters, power-ups. Make the install feel like continuing their progress.
9. Load Time
Every second of loading costs you players. Platform file size limits exist for a reason. Some cap at 5MB, others at 10MB. Optimize ruthlessly.
Optimization Strategies
Start with 20 Seconds or Less
Shorter playables reduce churn and boost CTR by ~15%. Ads over 25 seconds see 80% higher churn rates. Exception: simulation or puzzle games can support slightly longer experiences.
Test One Mechanic at a Time
Don’t showcase your entire feature set. Isolate the core action that defines your game. Match, shoot, merge, build. Whatever it is, make it obvious and satisfying.
Optimize Your End Card
Place the install button center-screen. Add a reward preview or progression tease. Test interactive vs. static end cards. The 47% CTR lift from interactive end cards is real.
Use Concrete CTAs
“Install for 100 free gems” beats “Download now.” Specificity converts. Tie the CTA to what the player just experienced in the playable.
A/B Test Relentlessly
Shorter, tighter playables tend to outperform longer ones on CVR, but the exact lift depends on genre and mechanic. Test length alongside everything else. Systematic creative performance analysis turns that into a repeatable process: 70% to proven performers, 20% to promising tests, 10% to experimental concepts.
Monitor Platform Limits
Each ad network has different file size caps and technical requirements. AppLovin, Unity, Meta all have specific specs. Optimize per platform.
Set Performance Alerts
If CTR dips below 3%, review and iterate immediately. Don’t wait for campaigns to burn budget before reacting.
Balance Quality vs. IPM
Authentic gameplay creatives attract high-quality users but may generate lower IPM. Non-authentic creatives spike IPM but deliver lower-quality installs. Test both approaches and measure downstream retention rate and LTV.
Common Mistakes
Misleading Gameplay
Showing features that don’t exist in the real game. Generates clicks, kills CVR and retention. Players feel tricked and churn immediately.
Overcomplicated Mechanics
Trying to showcase three different gameplay systems in 15 seconds. Players get confused and bail.
Weak End Cards
Finishing the playable experience with a boring static screen and tiny CTA. Missing the conversion moment entirely.
Ignoring File Size
Building a beautiful 15MB playable that violates platform limits. It never loads, so CVR stays at zero.
No Testing Framework
Running one playable creative and hoping it works. Performance requires iteration. Test lengths, mechanics, CTAs, and end cards systematically.
Generic CTAs
“Play now” and “Download” don’t convert as well as reward-specific messaging tied to the playable experience.
Too Long
Believing more gameplay equals better performance. Players decide in 15-20 seconds. Anything longer introduces unnecessary churn.
Related Terms
- Playable Ads – Interactive ad format letting users try gameplay before installing
- CVR (Conversion Rate) – Percentage of users who complete desired action after ad interaction
- End Card – Final screen in video or playable ad featuring CTA and install button
- CTR (Click-Through Rate) – Percentage of users who click an ad after viewing it
- IPM (Installs Per Mille) – Number of installs per 1,000 ad impressions
- CPI (Cost Per Install) – Average cost to acquire one app install through paid UA
External Resources
- Playable Ads That Convert: Stats and Strategies for Mobile Game Success – RevX
- Why Playable Ads Are Dominating Mobile UA And How You Can Win Big – Segwise
- Mobile Game Conversion Rates (2025) – Business of Apps
Frequently Asked Questions
Is a 2.5% conversion rate good for a playable ad?
Yes, that’s within the solid range. Playable conversion rate typically runs 2-4% across genres and networks. Hyper-casual games can push higher, 4-5%+, thanks to simpler mechanics and faster install decisions.
What is an acceptable conversion rate for a playable?
2-4% is the general benchmark, but compare against your own baseline and category first. Mid-core and strategy games typically land lower in that range than hyper-casual titles.
How does playable conversion rate differ from video conversion rate?
Playable CVR measures installs after someone actually plays a demo of your game. Video CVR measures installs after passive watching. Playable CVR runs lower in absolute numbers because completing a playable takes more effort, but those installs typically retain 15-25% better.
What is the formula for playable conversion rate?
Installs divided by playable completions, times 100. If 1,000 users finish your playable and 30 install, your playable CVR is 3%.